SPSS Multivariate Analysis Explained
When your research gets complex, SPSS steps up in a big way. For university students in the USA, where projects push boundaries, or learners worldwide handling tricky datasets, IBM SPSS offers tools beyond the basics. Multivariate analysis is one of those power moves, letting you juggle multiple variables at once. It’s not beginner territory, but it’s not out of reach either. Let’s unpack three steps to explain SPSS multivariate analysis, whether you’re leveling up a college study or diving deeper into research.
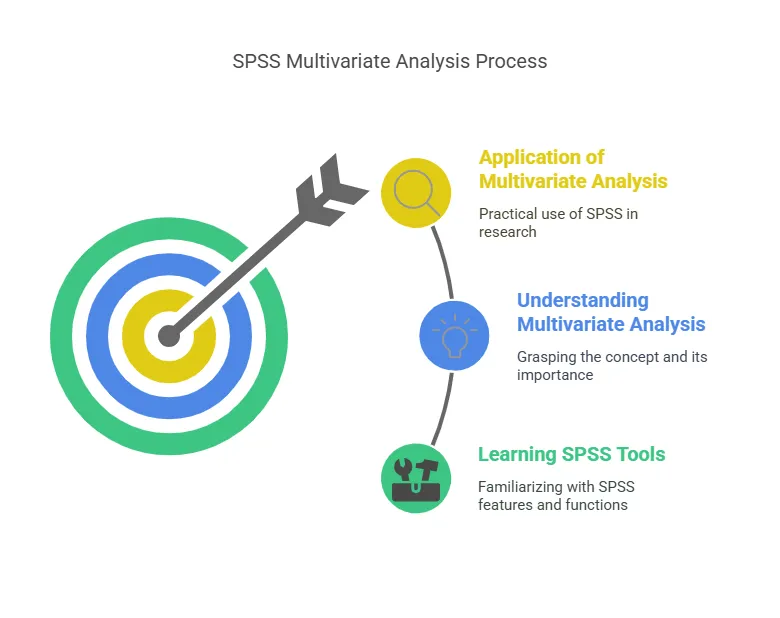
Step 1: Grasp the Big Picture
Multivariate analysis sounds fancy because it is. It’s about looking at several variables together, not just one or two. Maybe you’re a university student wondering how a bunch of factors play off each other. This is where SPSS multivariate analysis starts making sense.
Take Aisha, a grad student studying 80 people’s exercise, diet, and stress levels. She’s past simple tests; she wants the full picture. Multivariate analysis lets her see how all three interact. In SPSS, it’s tools like MANOVA or multiple regression. For students in the USA, aiming to impress, or learners globally, step one is knowing this: it’s about relationships, not solo stats. That’s your mindset shift.
Step 2: Prep Your Data for the Deep Dive
Before you run anything, your data needs to be solid. Open SPSS, and load your set. Aisha’s got her 80 rows: “ExerciseMinutes,” “DietScore,” “StressLevel.” She checks Variable View, ensuring types are right (numeric, not string). It’s a bit of work, but it pays off.
She clicks “File,” “Open,” or types it in. For university students in the USA, crunched for time, or learners elsewhere, this step matters. Messy data? SPSS won’t forgive it here. Aisha spots a typo, fixes it with “Edit,” and moves on. Your SPSS multivariate analysis hinges on this: clean, ready numbers. Get it tight, and you’re set.
Step 3: Run It and Read the Layers
Now, the fun begins. Aisha picks “Analyze,” then “General Linear Model,” and “Multivariate.” She sets “StressLevel” as the dependent, “ExerciseMinutes” and “DietScore” as independents, and runs it. The output’s dense: tables showing effects. Exercise cuts stress, diet helps too, and together they’re stronger.
It’s not simple like a t-test, but it’s rich. For college students in the USA, this is thesis-level stuff. For learners worldwide, it’s a research booster. SPSS multivariate analysis takes practice to read, but Aisha sees the payoff: layered insights. That’s your goal: not just answers, but connections.
Why This Matters for You
Complex data can stall anyone. Maybe you’re a university student in the USA, chasing a standout project, or a learner anywhere, wrestling with variables. That’s tough. But SPSS multivariate analysis turns it around. Understanding it, prepping well, and running it right open new doors.
In the USA, where research depth counts, this skill shines. Globally, it’s a universal edge. At SPSS Solutions, we’re here to demystify it. This explanation of SPSS multivariate analysis is your step up. Try it, and watch your work grow.
FAQs: Quick Answers to Dig In
Q: Is multivariate analysis for beginners?
A: Not quite. Master basics first.
Q: Can it work for college studies?
A: Yes. Aisha’s 80 rows nailed it.
Q: How do I know it’s right for me?
A: Got multiple variables? It fits.
Q: Is it the same everywhere?
A: Yup. SPSS keeps it consistent.
Q: What if my output confuses me?
A: Start small, reread, and practice.
Further Reading
- Field, A. (2018). Discovering statistics using IBM SPSS Statistics (5th ed.). SAGE Publications.
- Pallant, J. (2020). SPSS survival manual: A step-by-step guide to data analysis using IBM SPSS (7th ed.). McGraw-Hill Education.
- IBM Corporation. (2023). IBM SPSS Statistics 29 documentation. IBM. https://www.ibm.com/docs/en/spss-statistics/29.0.0