SPSS PROCESS Macro Tutorial
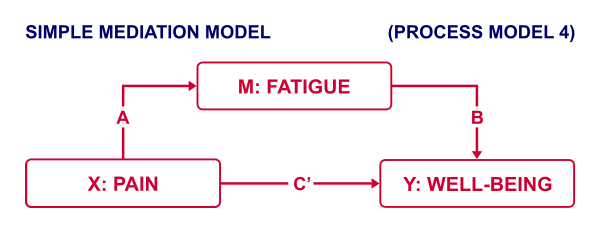
SPSS PROCESS Macro Tutorial By Ruben Geert van den Berg under Regression Downloading & Installing PROCESS Creating Tables instead of Text Output Using PROCESS with Syntax PROCESS Model Numbers PROCESS & Dummy Coding Strengths & Weaknesses of PROCESS What is PROCESS? PROCESS is a freely downloadable SPSS tool for estimating regression models with mediation and/or

SPSS Moderation Regression Tutorial

SPSS Moderation Regression Tutorial By Ruben Geert van den Berg under Regression SPSS Moderation Regression – Example Data SPSS Moderation Regression – Dialogs SPSS Moderation Regression – Coefficients Output Simple Slopes Analysis I – Fit Lines Simple Slopes Analysis II – Coefficients A sports doctor routinely measures the muscle percentages of his clients. He also

SPSS Missing Values Tutorial

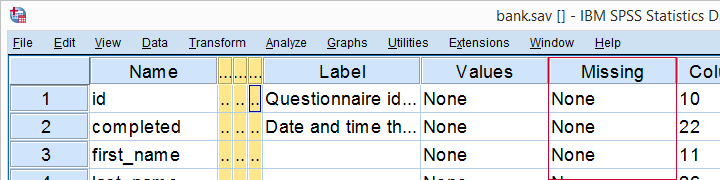
SPSS Missing Values Tutorial By Ruben Geert van den Berg under Basics Contents SPSS System Missing Values SPSS User Missing Values Setting User Missing Values Inspecting Missing Values per Variable SPSS Data Analysis with Missing Values What are “Missing Values” in SPSS? In SPSS, “missing values” may refer to 2 things: System missing values are

SPSS Two-Way ANOVA with Interaction Tutorial

SPSS Two-Way ANOVA with Interaction Tutorial By Ruben Geert van den Berg under ANOVA Introduction & Practice Data File Do you think running a two-way ANOVA with an interaction effect is challenging? Then this is the tutorial for you. We’ll run the analysis by following a simple flowchart and we’ll explain each step in simple

SPSS One-Way ANOVA Tutorial

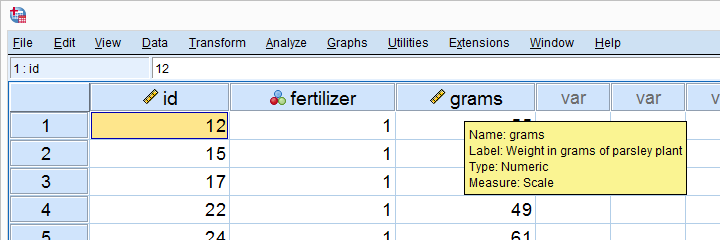
SPSS One-Way ANOVA Tutorial By Ruben Geert van den Berg under ANOVA For reading up on some basics, see ANOVA – What Is It? One-Way ANOVA – Null Hypothesis ANOVA Assumptions SPSS ANOVA Flowchart SPSS One-Way ANOVA Dialog SPSS ANOVA Output ANOVA – APA Reporting Guidelines ANOVA Example – Effect of Fertilizers on Plants A

SPSS Paired Samples T-Test Tutorial

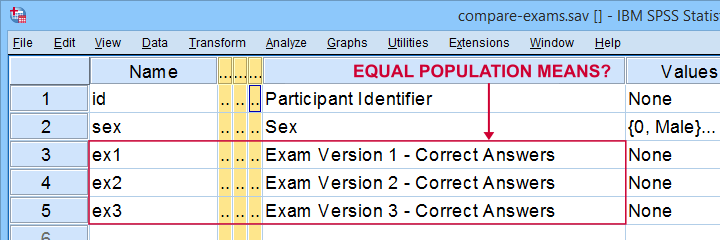
SPSS Paired Samples T-Test Tutorial By Ruben Geert van den Berg under Statistics A-Z & T-Tests A paired samples t-test examines if 2 variables are likely to have equal population means. Paired Samples T-Test Assumptions SPSS Paired Samples T-Test Dialogs Paired Samples T-Test Output Effect Size – Cohen’s D Testing the Normality Assumption Example A

SPSS Hierarchical Regression Tutorial

SPSS Hierarchical Regression Tutorial By Ruben Geert van den Berg under Regression Hierarchical regression comes down to comparing different regression models. Each model adds 1(+) predictors to the previous model, resulting in a “hierarchy” of models. This analysis is easy in SPSS but we should pay attention to some regression assumptions: linearity: each predictor has

SPSS Z-Test for Independent Proportions Tutorial

SPSS Z-Test for Independent Proportions Tutorial By Ruben Geert van den Berg under Nonparametric Tests Z-Test – Assumptions SPSS Z-Tests Dialogs SPSS Z-Test Output SPSS Z-Tests – Strengths & Weaknesses APA Reporting Z-Tests A z-test for independent proportions tests if 2 subpopulations score similarly on a dichotomous variable. Example: are the proportions (or percentages) of