How to Compute Means in SPSS?

How to Compute Means in SPSS? By Ruben Geert van den Berg under Factor Analysis Introduction & Practice Data File This tutorial shows how to compute means over both variables and cases in a simple but solid way. We encourage you follow along by downloading and opening restaurant.sav, part of which is shown below. Quick

Creating Histograms in SPSS

Creating Histograms in SPSS By Ruben Geert van den Berg under Charts in SPSS Introduction & Practice Data File Among the very best SPSS practices is running histograms over your quantitative variables. Doing so is a super fast way to detect problems such as extreme values and gain a lot of insight into your data.

SPSS Scatterplots & Fit Lines Tool

SPSS Scatterplots & Fit Lines Tool By Ruben Geert van den Berg under SPSS Tools & Regression Contents Example Data File Prerequisites and Installation Example I – Create All Unique Scatterplots Example II – Linearity Checks for Predictors Visualizing your data is the single best thing you can do with it. Doing so may take

SPSS Z-Test for a Single Proportion

SPSS Z-Test for a Single Proportion By Ruben Geert van den Berg under Nonparametric Tests Z-Test – Assumptions SPSS Z-Test Dialogs SPSS Z-Test Output APA Style Reporting Z-Tests References A z-test for a single proportion tests if some population proportion is equal to x. Example: does a proportion of 0.60 (or 60%) of all Dutch

Understanding the Empirical CDF (Cumulative Distribution Function)

Empirical CDF

Understanding the Empirical CDF (Cumulative Distribution Function) In statistical analysis, visualizing and understanding data distributions is essential for drawing meaningful conclusions. The empirical CDF, or empirical cumulative distribution function, is a powerful tool that represents the cumulative proportion of data points at or below a given value in a dataset. Unlike theoretical CDFs, which assume

Understanding the MSE Formula

MSE Formula Important

Understanding the MSE Formula In statistical modeling, particularly regression analysis, evaluating model performance is critical for ensuring accurate predictions. The MSE formula, or Mean Squared Error formula, is a widely used metric to assess the accuracy of a regression model by quantifying the average squared difference between predicted and actual values. MSE provides researchers with

Understanding Contingency Tables

Why Use Contingency Tables

Understanding Contingency Tables: A Guide for Researchers In statistical analysis, a contingency table is a powerful tool for examining the relationship between two or more categorical variables. Also known as a cross-tabulation or crosstab, it organizes data into a matrix format, displaying the frequency distribution of variables to reveal potential associations. Contingency tables are widely

Understanding the Range Rule of Thumb

Understanding the Range Rule of Thumb: A Guide for Researchers In statistical analysis, understanding data variability is crucial for interpreting research findings. The range rule of thumb is a simple, practical method for estimating the standard deviation of a dataset using its range—the difference between the maximum and minimum values. This quick approximation is particularly

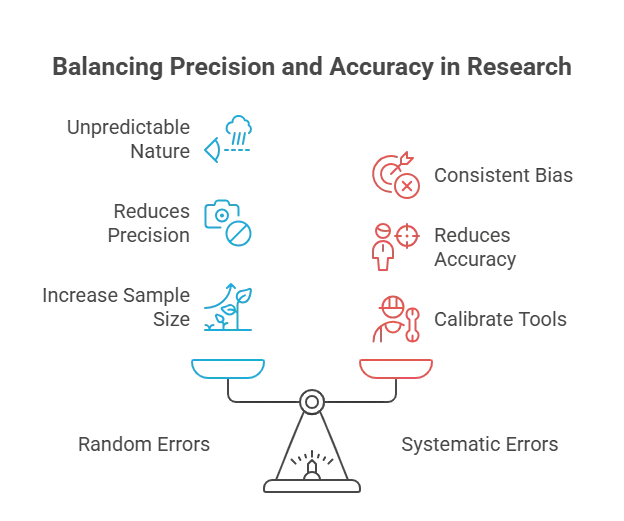
Random vs Systematic Error: Understanding Their Impact on Research

Differences Between Random and Systematic Errors

Random vs Systematic Error: Understanding Their Impact on Research In research, the accuracy and reliability of data are critical for drawing valid conclusions. Two types of measurement errors—random vs systematic error—can affect the quality of research outcomes. Random errors introduce unpredictable variability into measurements, while systematic errors cause consistent biases that skew results in a