SPSS One-Way ANOVA Tutorial

SPSS One-Way ANOVA Tutorial By Ruben Geert van den Berg under ANOVA For reading up on some basics, see ANOVA – What Is It? One-Way ANOVA – Null Hypothesis ANOVA Assumptions SPSS ANOVA Flowchart SPSS One-Way ANOVA Dialog SPSS ANOVA Output ANOVA – APA Reporting Guidelines ANOVA Example – Effect of Fertilizers on Plants A

SPSS Paired Samples T-Test Tutorial

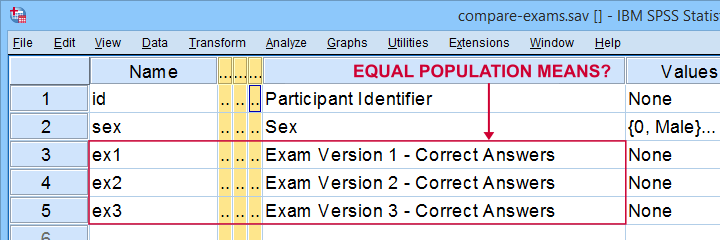
SPSS Paired Samples T-Test Tutorial By Ruben Geert van den Berg under Statistics A-Z & T-Tests A paired samples t-test examines if 2 variables are likely to have equal population means. Paired Samples T-Test Assumptions SPSS Paired Samples T-Test Dialogs Paired Samples T-Test Output Effect Size – Cohen’s D Testing the Normality Assumption Example A

SPSS Hierarchical Regression Tutorial

SPSS Hierarchical Regression Tutorial By Ruben Geert van den Berg under Regression Hierarchical regression comes down to comparing different regression models. Each model adds 1(+) predictors to the previous model, resulting in a “hierarchy” of models. This analysis is easy in SPSS but we should pay attention to some regression assumptions: linearity: each predictor has

SPSS Z-Test for Independent Proportions Tutorial

SPSS Z-Test for Independent Proportions Tutorial By Ruben Geert van den Berg under Nonparametric Tests Z-Test – Assumptions SPSS Z-Tests Dialogs SPSS Z-Test Output SPSS Z-Tests – Strengths & Weaknesses APA Reporting Z-Tests A z-test for independent proportions tests if 2 subpopulations score similarly on a dichotomous variable. Example: are the proportions (or percentages) of

What Is a Dichotomous Variable and Iportance in Research

What Is a Dichotomous Variable and Iportance in Research

What Is a Dichotomous Variable and Iportance in Research In research and data analysis, understanding different types of variables is crucial for accurate interpretation and statistical analysis. One essential type of variable that often appears in social sciences, health studies, and market research is the dichotomous variable. In this article, we will explore what a

Sort Variables in SPSS with Python

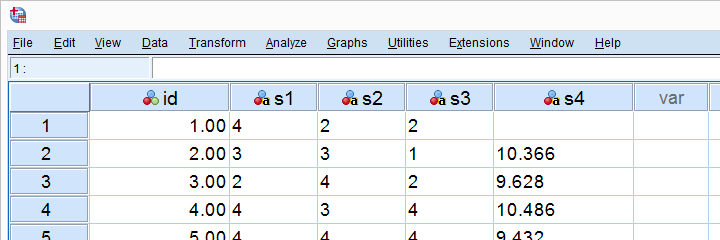
Sort Variables in SPSS with Python By Ruben Geert van den Berg under SPSS Python Basics We held a reaction time experiment in which people had to resolve 20 puzzles as fast as possible. The 20 answers and reactions times are in an SPSS data file which we named trials.sav. Part of if is shown

Set SPSS Variable Names as Labels with Python

Set SPSS Variable Names as Labels with Python By Ruben Geert van den Berg under SPSS Python Basics Our previous lesson started out with a rather problematic data file. We reordered our variables with Python and saved our data as trials-ordered.sav, the starting point for this lesson. The screenshot below shows part of the data.

Looping over SPSS Commands with Python

Looping over SPSS Commands with Python By Ruben Geert van den Berg under SPSS Python Basics A nasty limitation of SPSS is that some commands take only one variable. Now, DO REPEAT and LOOP allow us to loop over variables but they are limited to SPSS transformation commands. Python, however, allows us to loop over